
For more detailed and updated information on Speedmaster 125 production totals – verified by the Omega Museum archives, please visit my site speedmaster125.com.
NOTE: This page has been retired. The data below is outdated and the charts have been replaced with an interactive chart that is easier to refresh. Please check it out here.
Omega’s serial numbers are a notoriously inexact science. They run roughly in ascending order over time, but dating an individual watch or movement to its year of manufacture is difficult. Omega can order an Extract of the Archives for a price, but they are not always available. Serial numbers can at best give a rough estimate. Most charts offer a 3-4 year window based on what the serial number begins with and there are numerous exceptions even to those rough estimates.
When serial number data is collected for individual calibres, patterns emerge. On this site I attempt to share the patterns using charts and tables, and to offer my own analysis and interpretations. A collector reading these illustrations can either accept my interpretations or draw their own conclusions, and I welcome differences of opinion and discussion.
Histograms – How Omega Distributes Serials
Omega calibres 1040 and 1041 were manufactured from 1971 through 1976 (give or take) and their serial numbers span from 30,000,1XX through 40,322,6XX based on my observations. Those give a range of over 10 million, though the lowest and highest I have seen appear to be outliers. Most fall between 31,640,000 and 38,290,000 a range of about 6.5 million.
Did Omega use and assign all of the possible numbers in that range? I honestly don’t know. How does Omega assign their serial numbers to watches? I don’t know the answer to that either. But the serials I’ve observed fall in closely arranged batches, leading me to believe that each movement of the scores they had in production at the time was assigned certain number ranges.
As we’ll see in the charts, there are certain batches that dominate certain references. And giant swaths of possible serials in range that have not been seen, likely because those numbers were designated for other calibres. Because of this, the histograms I use are not true histograms, which distribute the “bins” or ranges evenly. There are far too many empty bins (ranges with 0 serials observed) to make those charts readable.
As an example, here’s a true histogram featuring very broad ranges of 100,000 serials (first 3 numbers) for all references containing either cal. 1040 or 1041:
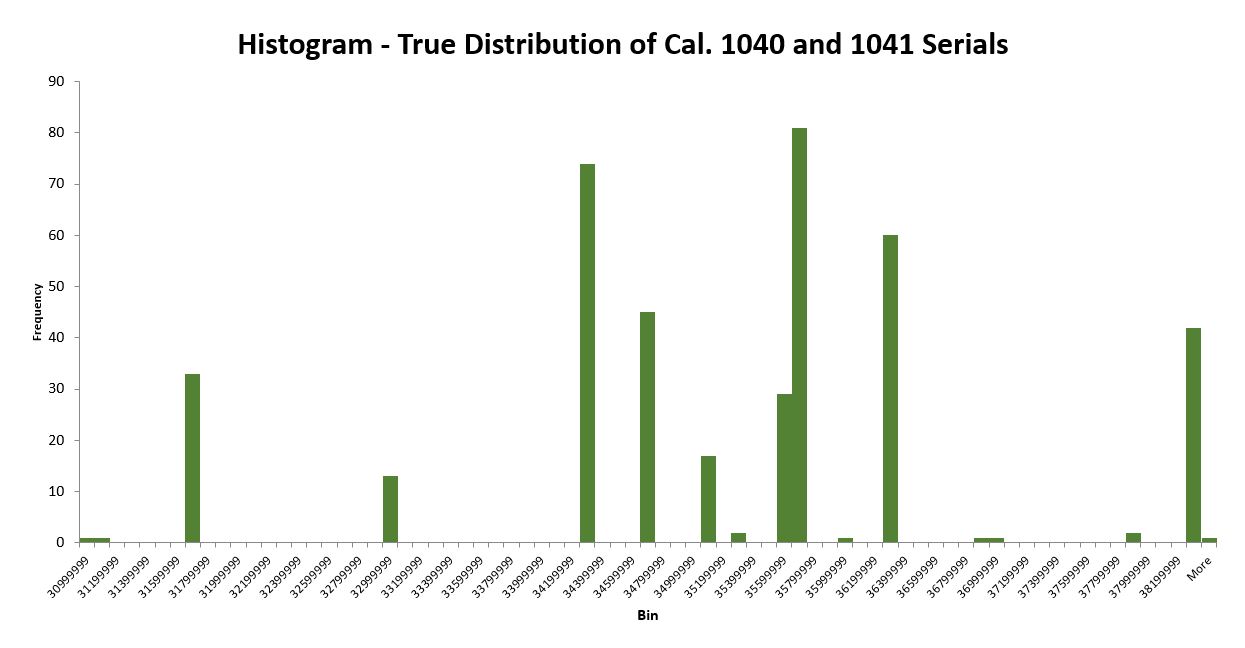
As you can see, there are only about 8 major concentrations, with a handful of random “outliers”. As such, the remaining charts ignore the empty bins.
Cal. 1040 and 1041 as a Whole
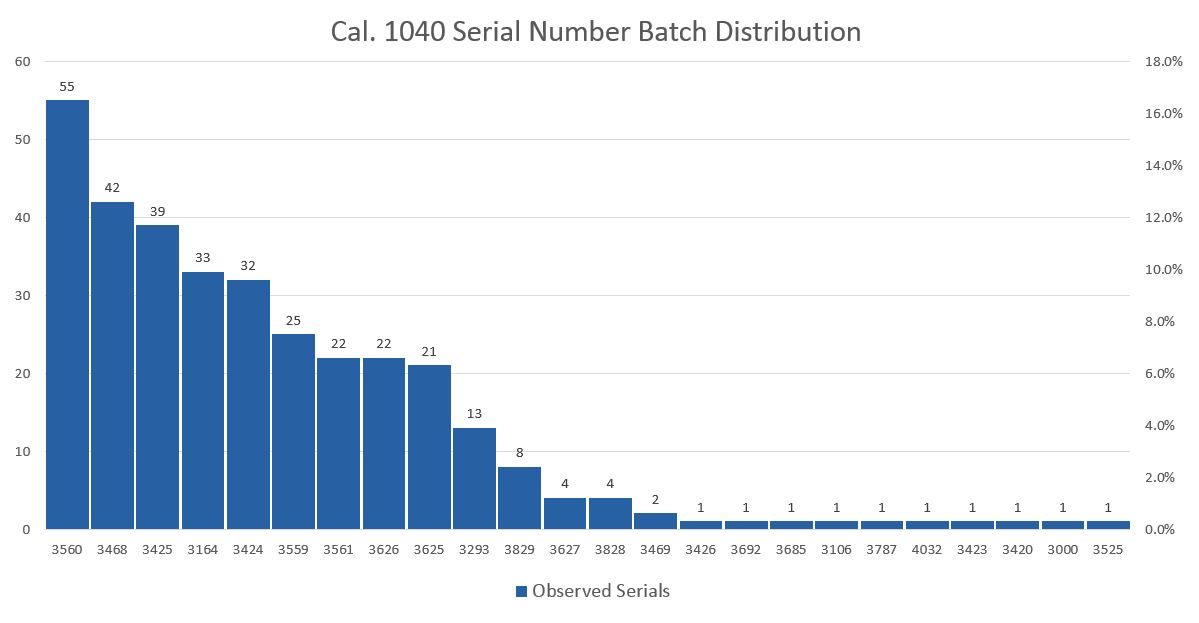
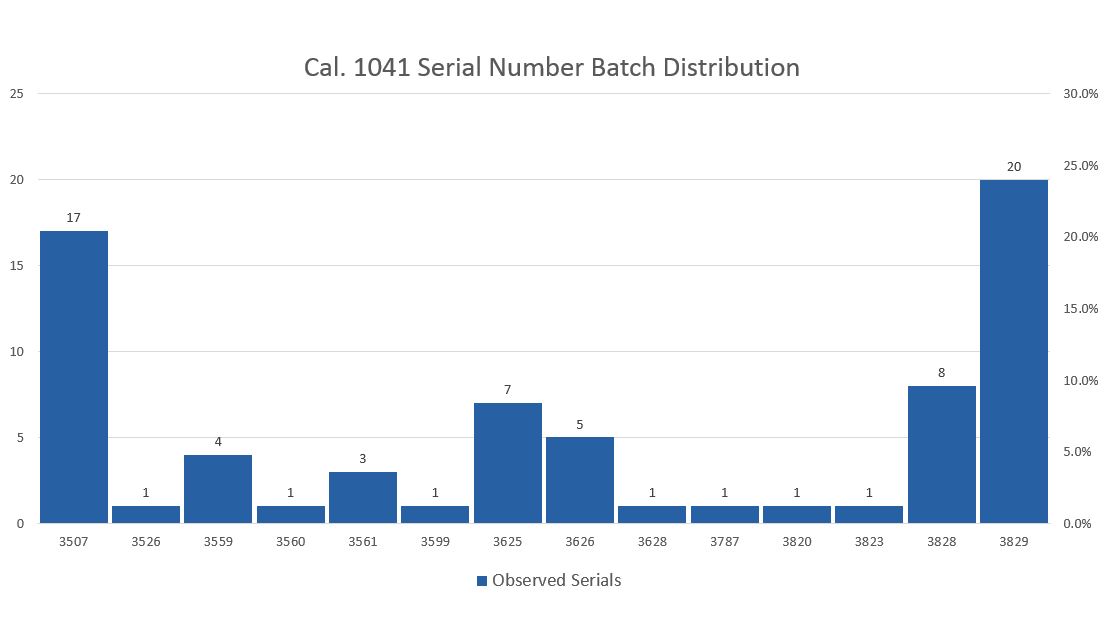
The following chart is more typical of how I look at the distribution. This is like a histogram, but it just isn’t evenly spaced over the possible range of serials.
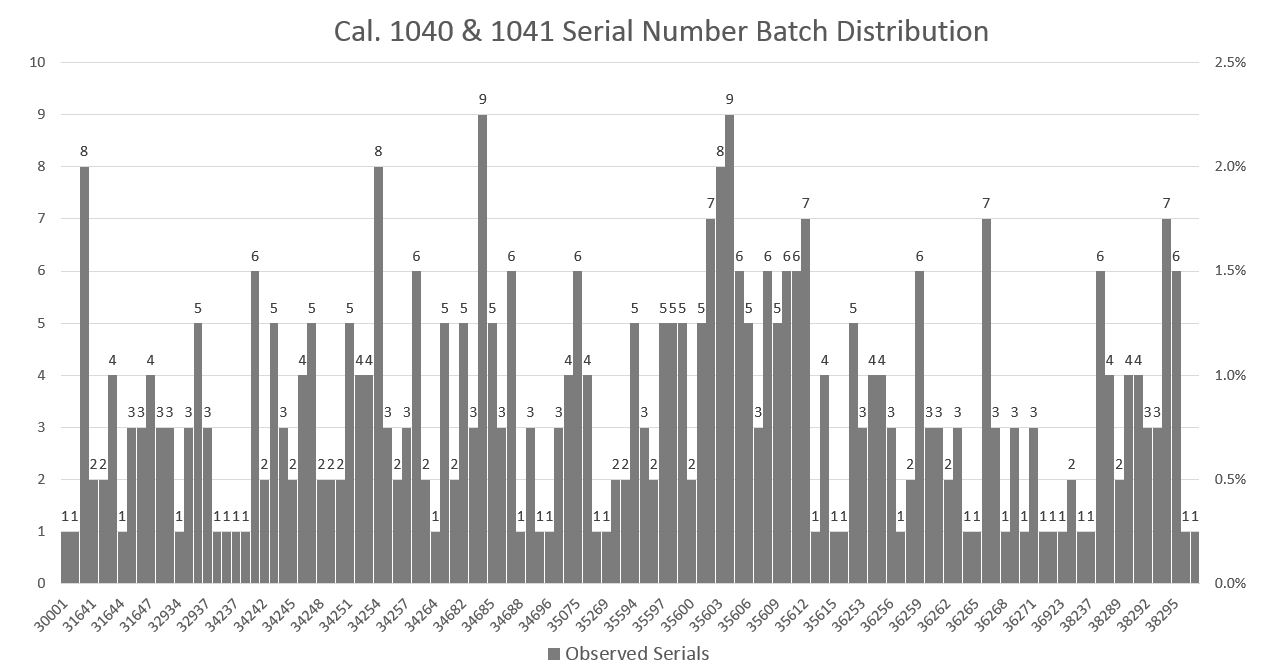
The above chart is based on “batches” with the same first 5 digits, which is a narrower band of 1,000. Depending on the specific slice of data I’m looking at, I will select the first 3, first 4, or first 5. The X axis is labeled on these charts, but I’ve also color coded the charts to identify the batch definition. Narrowest batches of the first 5 digits are grey, medium (first 4) are blue, broad (first 3) are green.
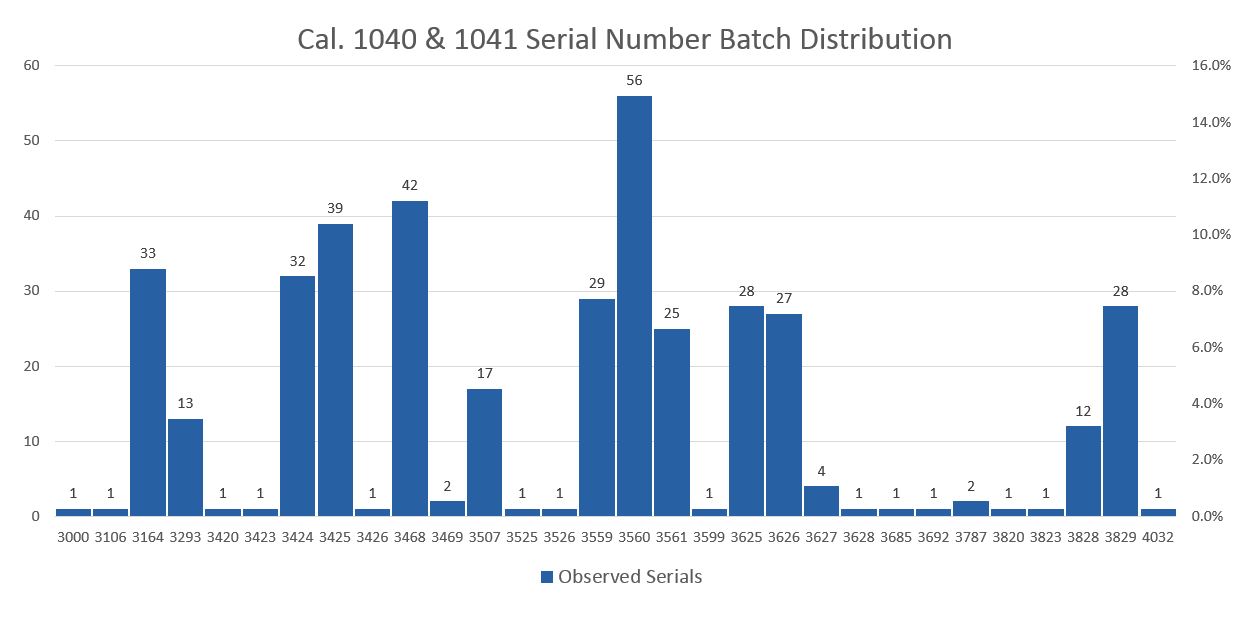
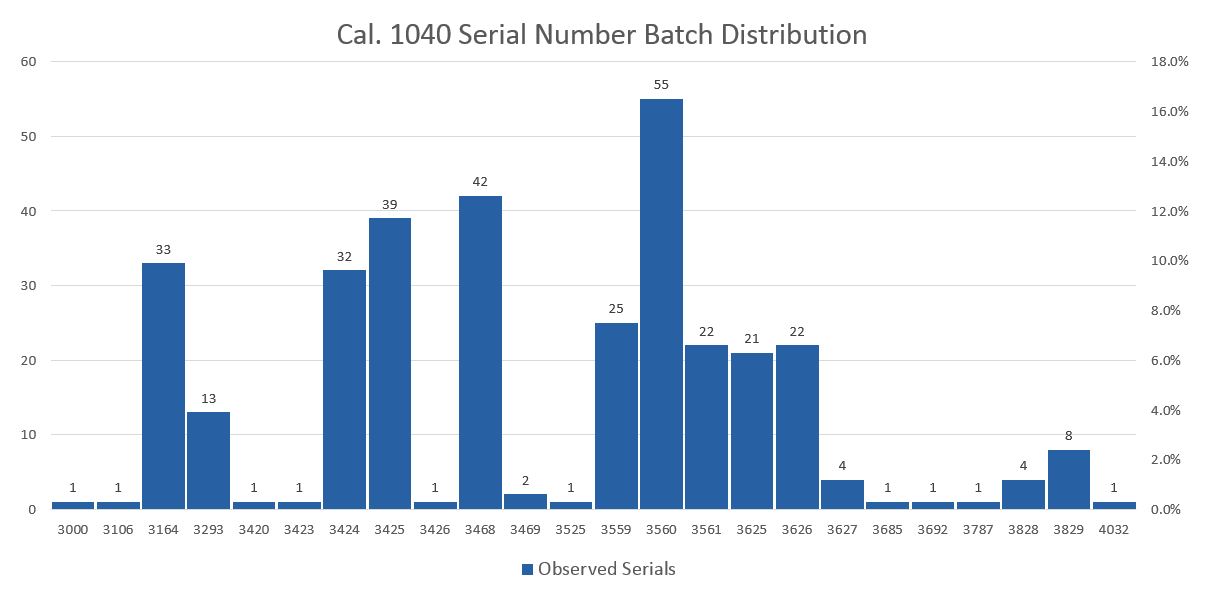
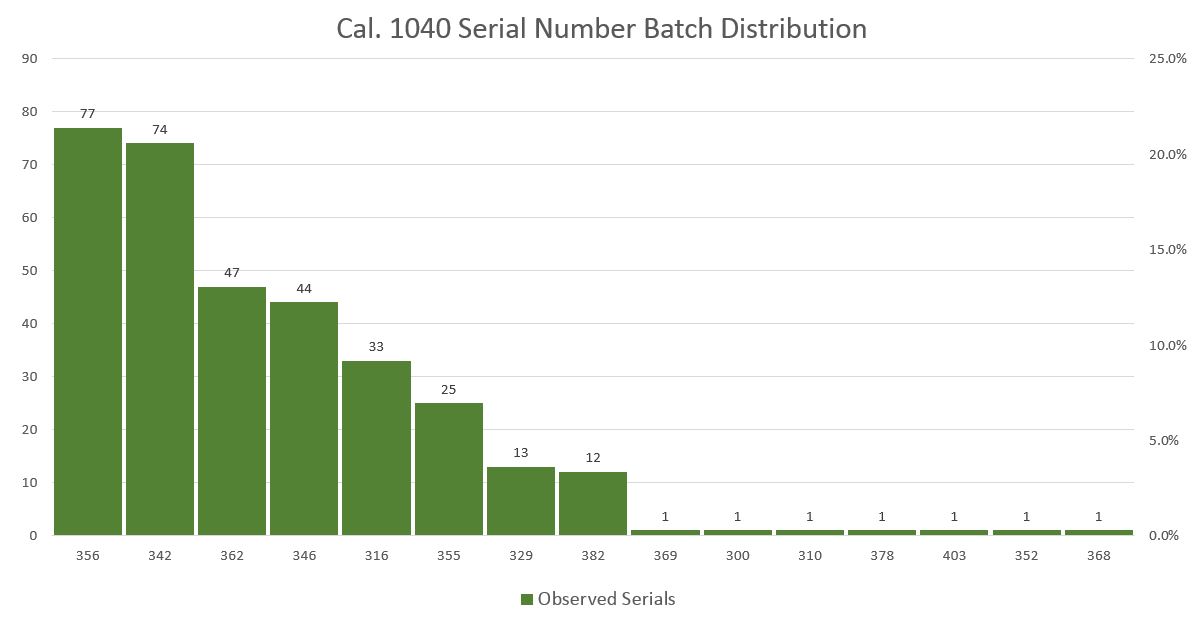
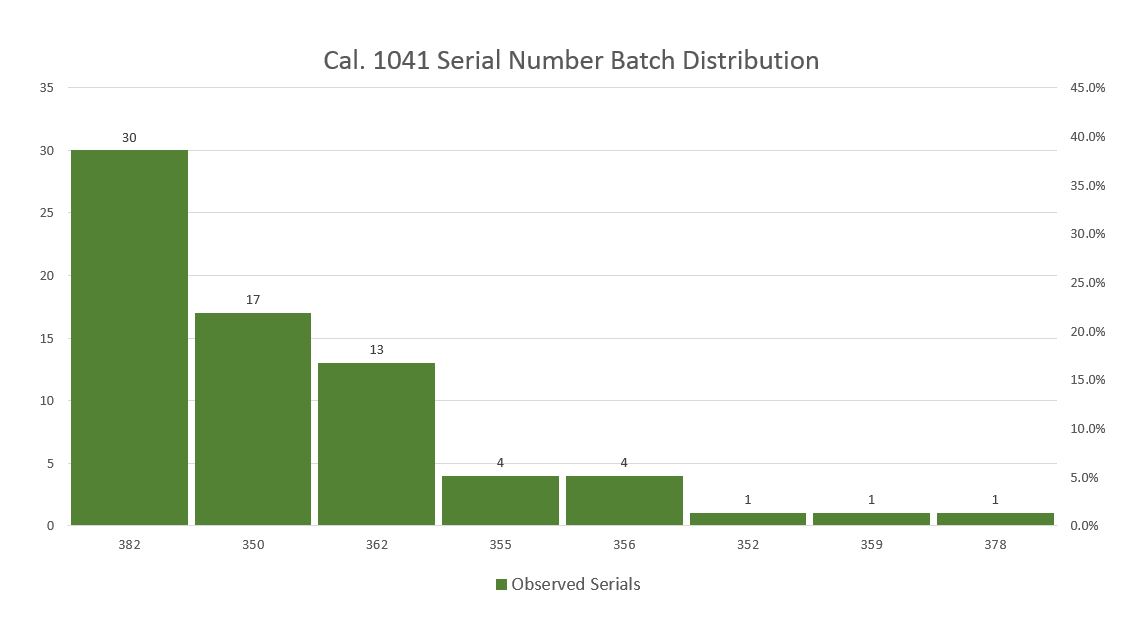
Here are the medium and broad looks at the same data:
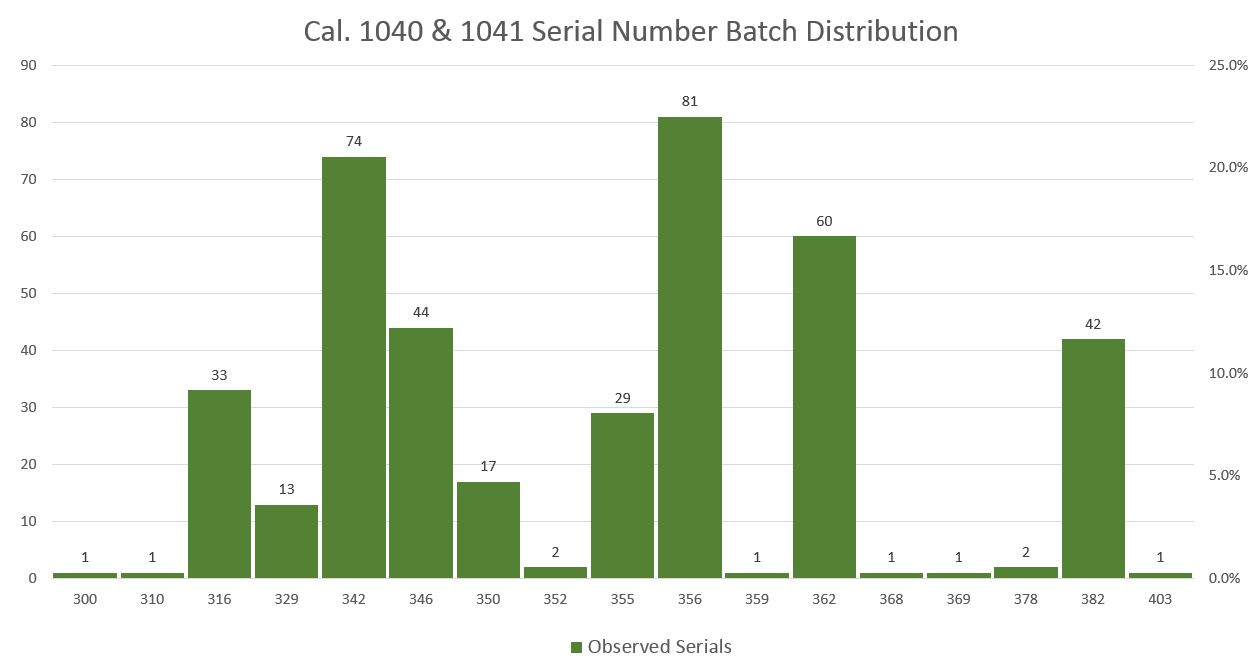
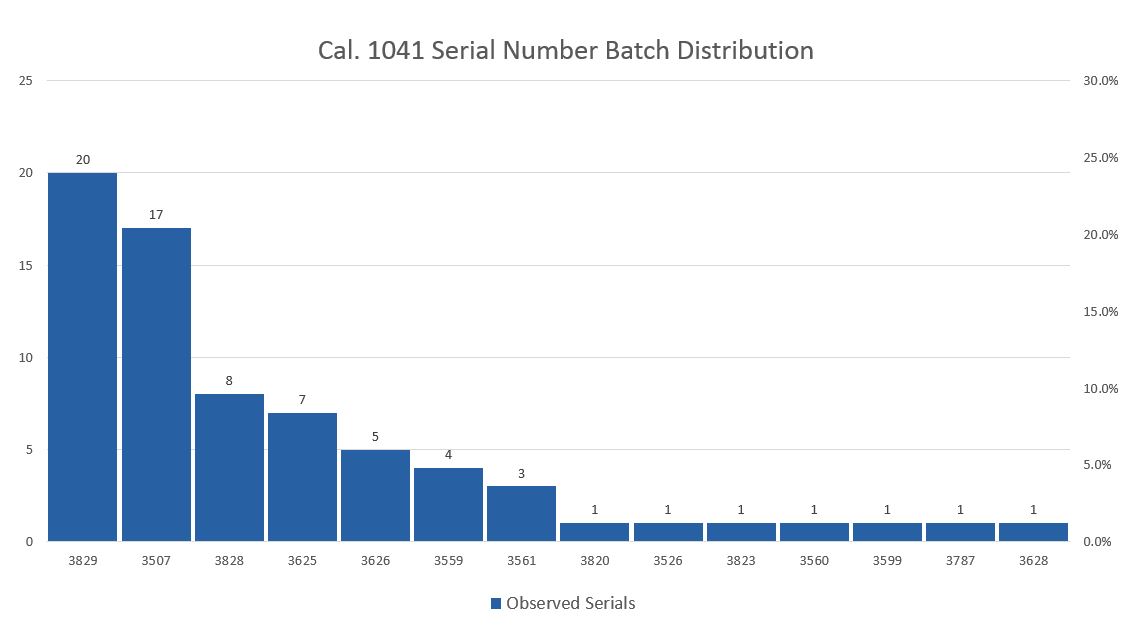
Also, to call out the most frequent or typically seen serials, I often sort from most to least frequent rather than in ascending serial order. I think this is more helpful to collectors. And because I’m not showing the “empty sets”, numerical order over time is less useful, in my opinion. Here’s the same chart as the previous one, sorted by frequency:

Other Cuts of Data
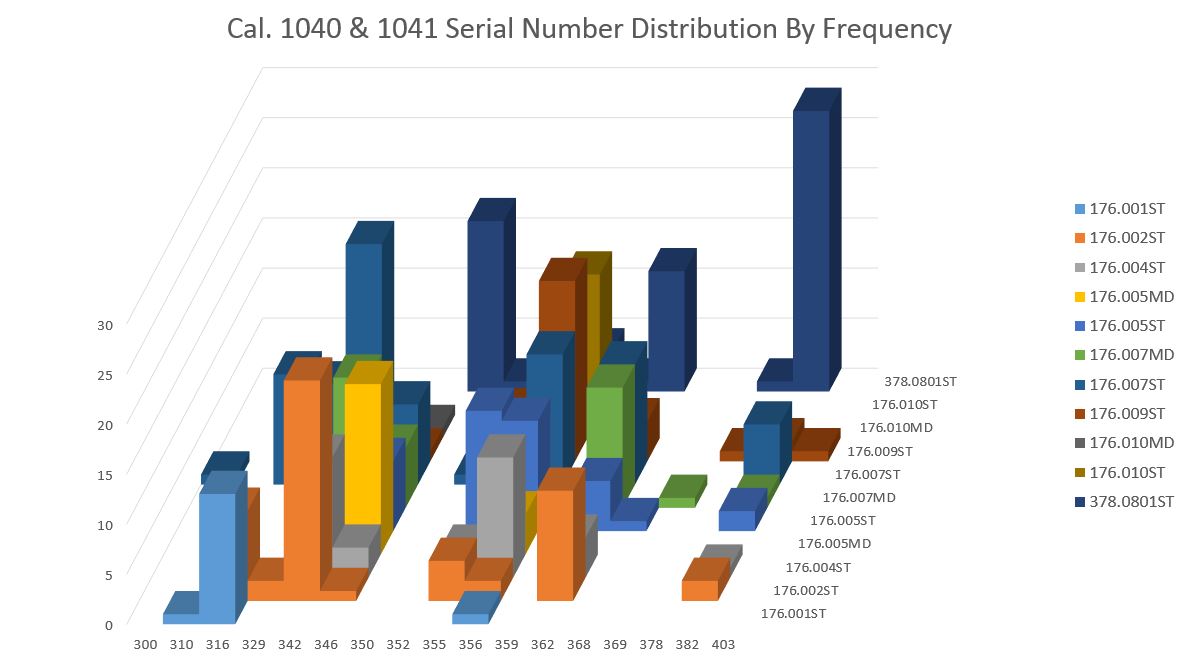
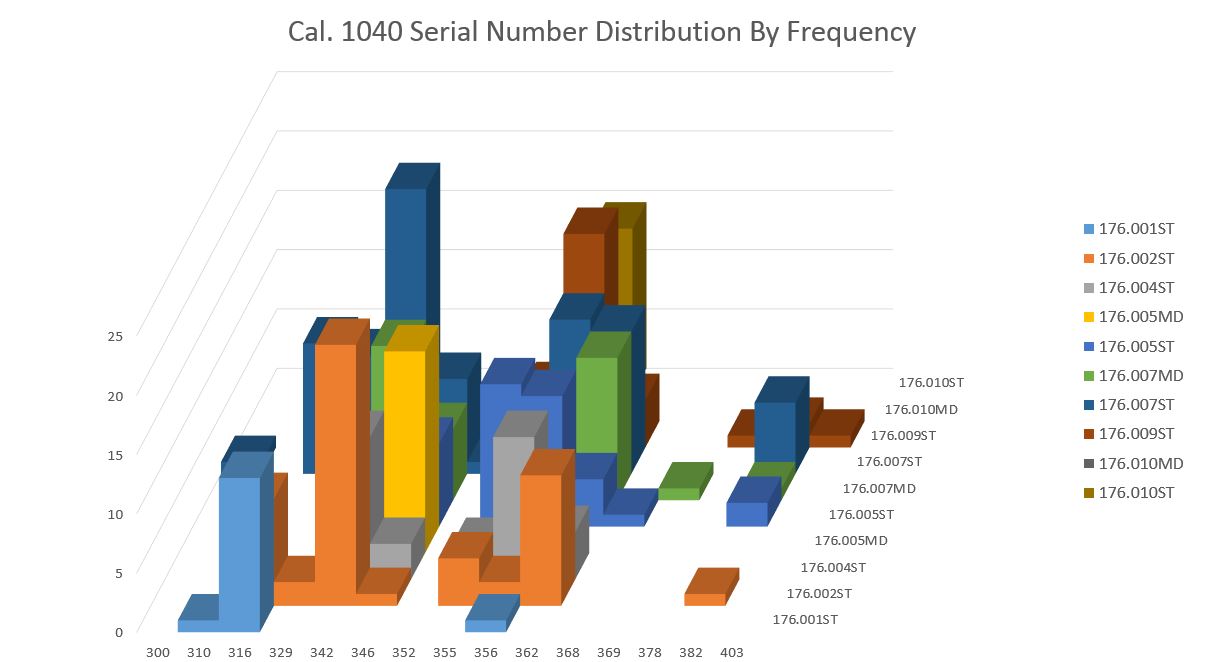
This 3D chart identifies each reference by color, and the height of the column signifies the frequency. It is sorted numerically in an attempt to illustrate which references were being made in which batch, roughly chronologically.

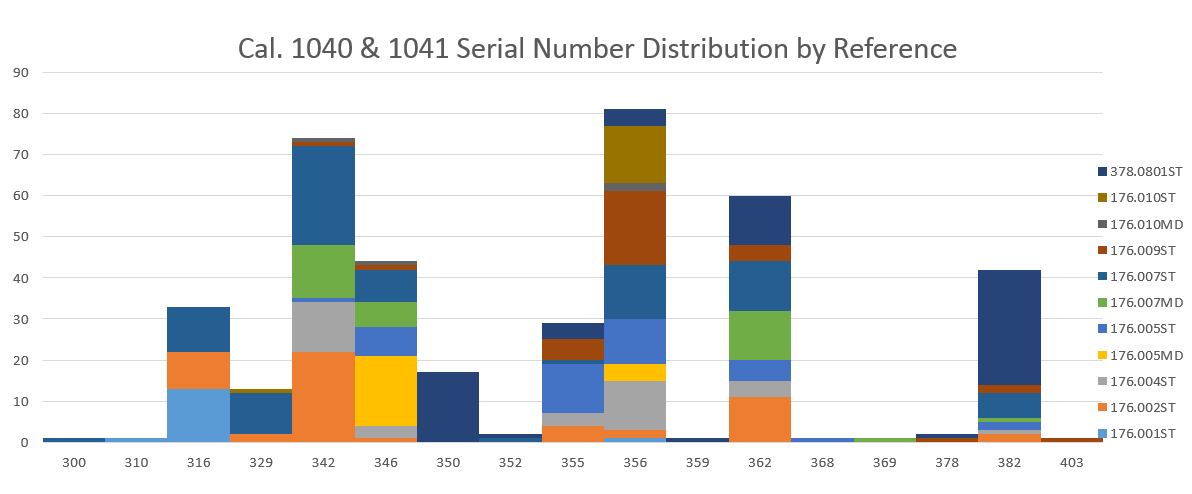
Here’s a stacked bar showing the same data.
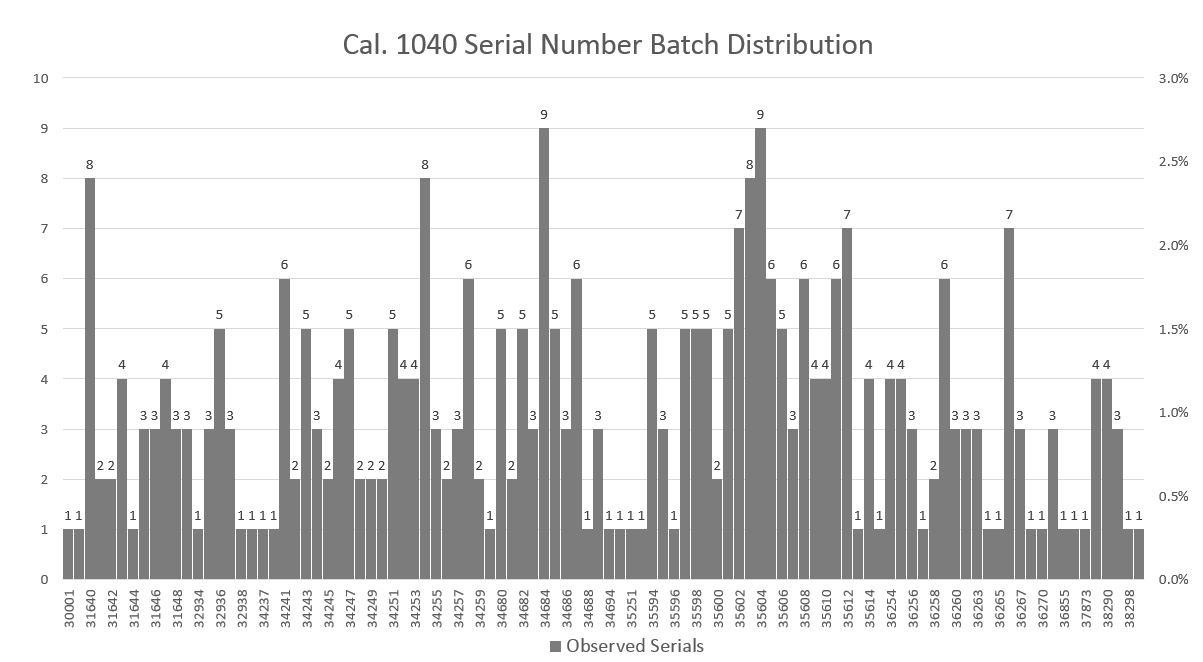
Cal. 1040 Only
The following charts cover the same ground as above, but filter out cal. 1041.
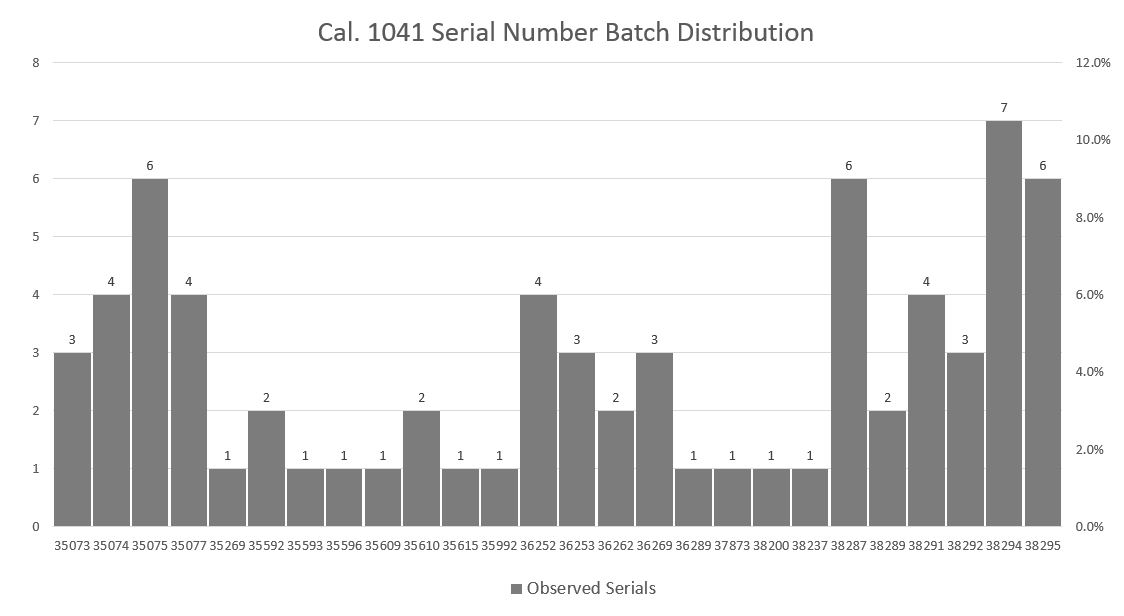
Cal. 1041 Only
Since there was only one watch (the Speedmaster 125) that used cal. 1041, these charts are a little more straightforward.
Distribution by Reference
Check out the Case References Collector’s Guides for charts by reference.
Extracts from the Archives
This data is harder to come by. I only have 25 data points to go from.
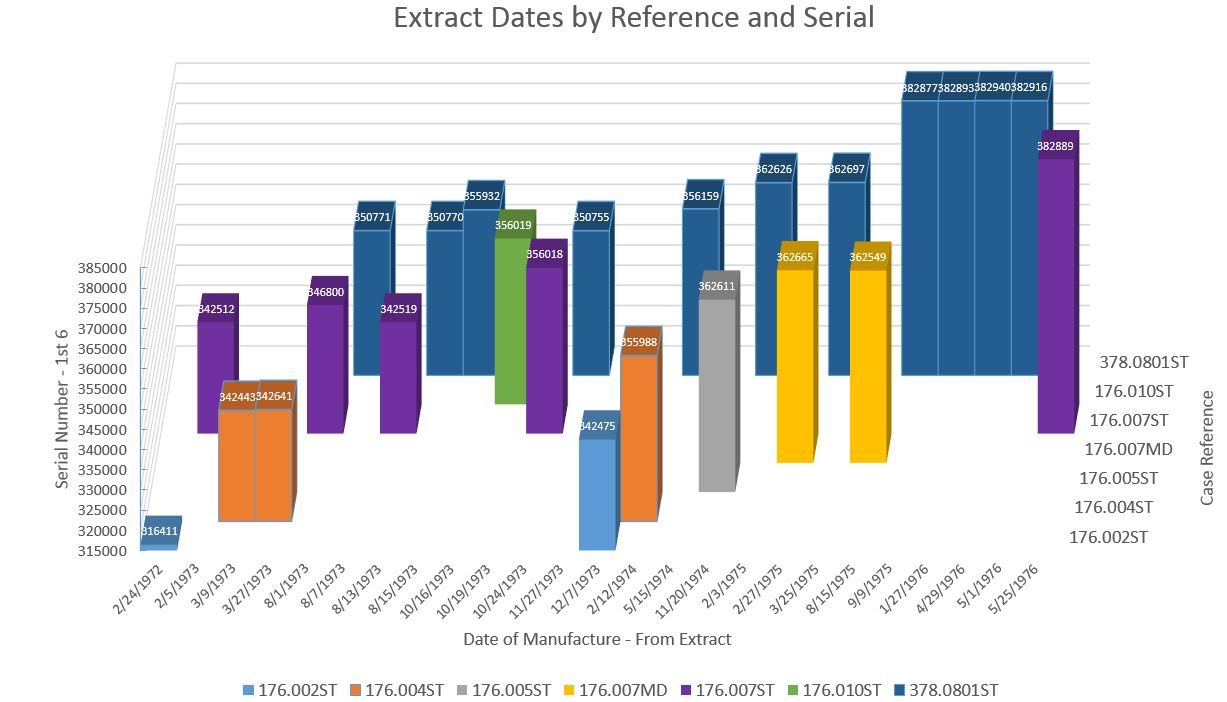
This one is tricky to read but it illustrates the general correlation between serial numbers and time. The columns are taller the higher the serial number and as the years go by the columns are generally taller. The colors indicate which case reference the Extract was for.