
Using Serial Numbers to Estimate Production
Since November of 2015 I’ve been collecting serial numbers, production data from Archive Extracts, and sales dates from receipts or warranty papers from cal. 1040 and 1041 Omegas. I was hoping to establish clear production timeframes and lower and upper serial limits for each reference in the family, but I’ve stumbled onto something pretty interesting that I wasn’t looking for: production estimates by reference.
At first I was just documenting as I stumbled across a serial number, usually in forum threads or eBay auctions. Later I searched a little more methodically at old sales ads and auction listings, searching each source by each reference. My spreadsheet looks like this:
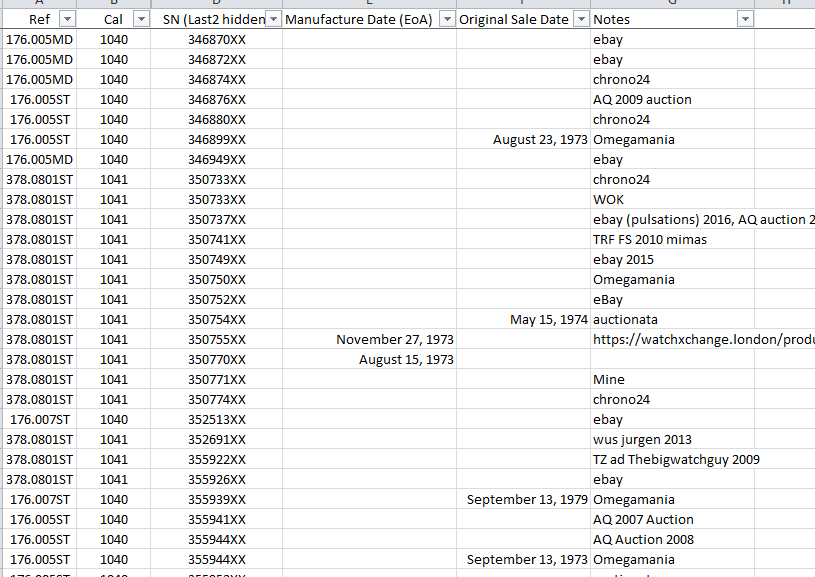
I document the entire SN if it is given or visible and the SN is only obscured for this article. If someone obscures the last several digits I only keep it on my list until I find another watch that could be a duplicate (so a 176.007ST showing 35592XXX is removed from the list if another 176.007ST comes along with a serial of 35592001, since even though the odds are only 1 in 1,000 that it is the same watch, it still could potentially be the same).
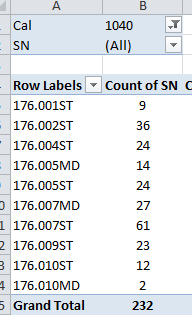
As my list grew, I started noticing an uneven distribution of case references. There were way more 176.007s than 176.004s, for example. This makes sense, since it just seems that the 007 was more common than the Big Blue. So I made a pivot table to break down the # of observations by reference for cal . 1040:
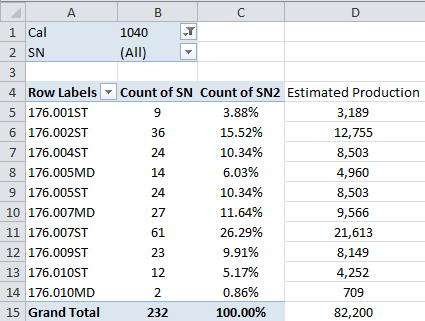
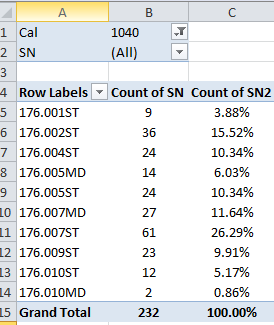
That distribution seems to generally match what you’d expect: -001 and -010 are fairly uncommon, -007 is the most common, etc. Next I added percentage:
Then I realized that because we know the total production of cal. 1040 from A Journey Through Time to be 82,200, a simple formula applying the above percentages to 82,200 generates some rough production estimates: