

I stumbled across the serial number of a 176.007 this morning. As I do every time I see a new SN, I added it to my list and refreshed my pivot table and charts. Every time I do this it affects my production estimates. I’d like to illustrate the effect in this post.
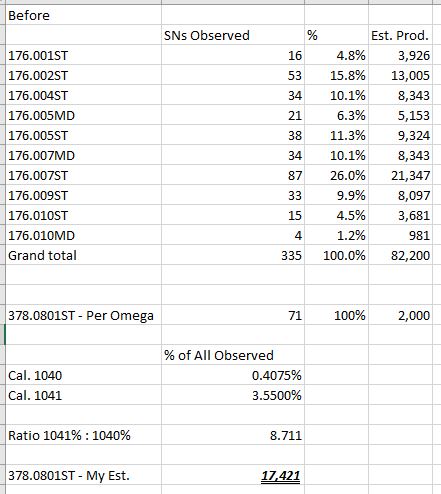
First, let’s take a look at the data before I recorded the new observation:
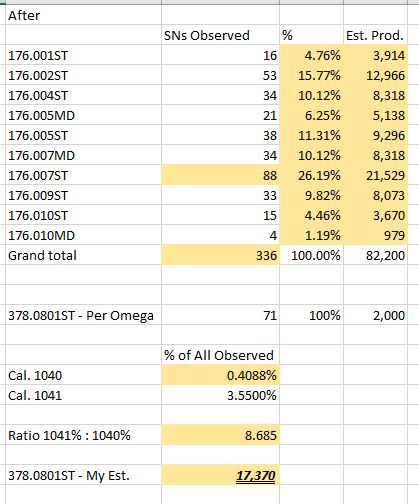
Once I enter the new SN and refresh, the table looks like this (numbers that change are shaded in yellow):
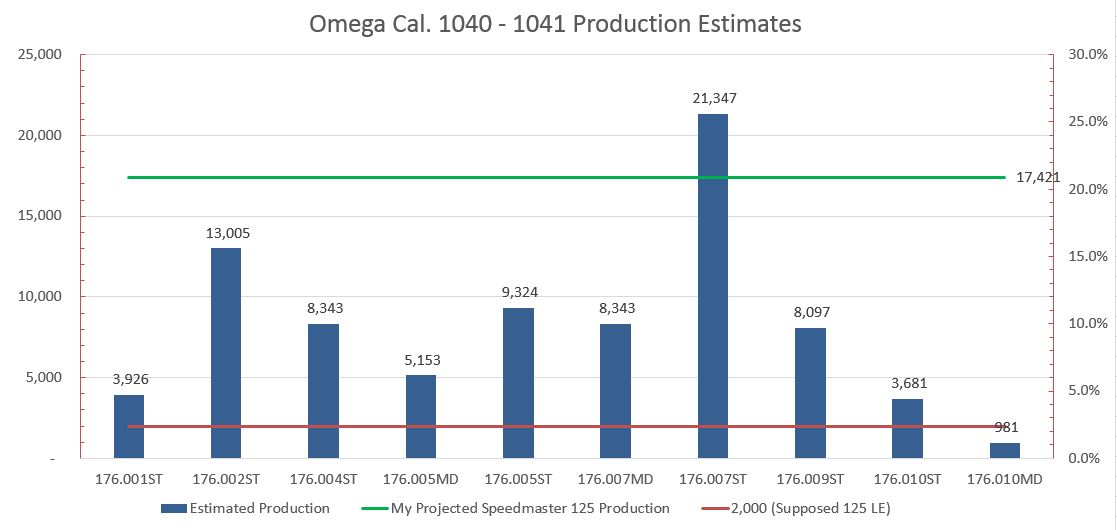
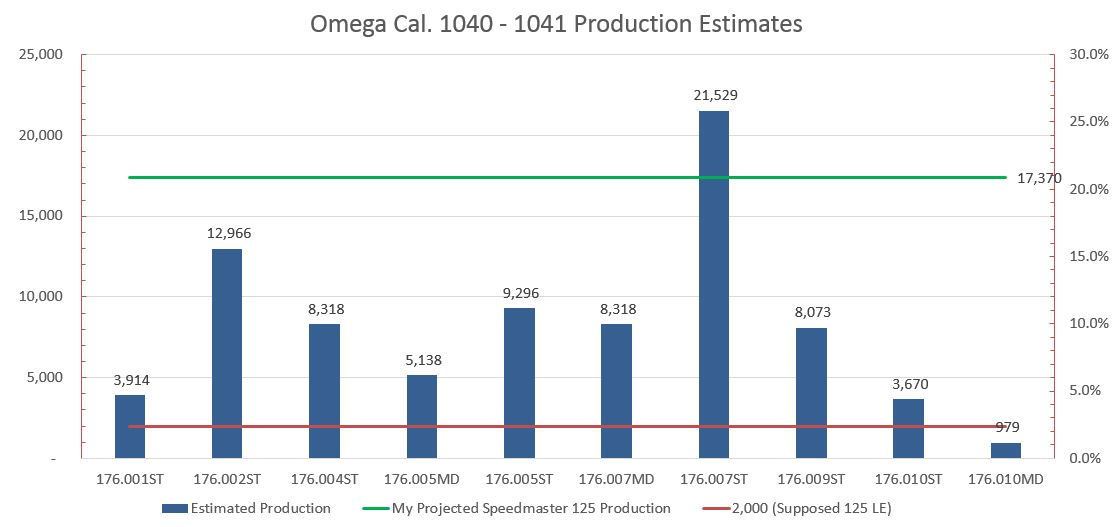
The new chart:
The changes are mostly subtle. Here’s the magnitude of the changes:
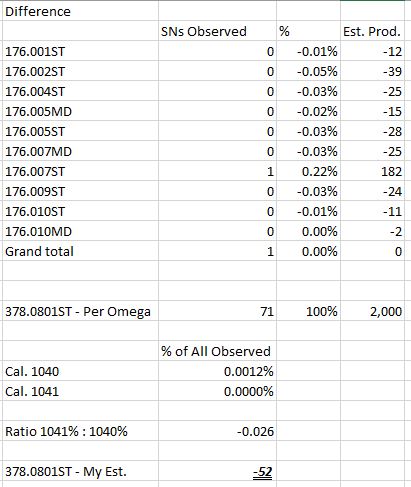
Because the total number of cal. 1040 serials is assumed to be known and fixed at 82,200, each new observation affects the proportions of all the other references. The impact is greatest for the reference observed, here being 176.007ST. That production estimate increased by 182 while the other 9 references had their estimates decrease by a collective 182, which is spread out based on each reference’s proportion of the whole.
Because I assume that the total production of cal. 1041 is unknown, the key number is the frequency at which I observe 1041 serials relative to 1040 serials. Here the ratio changes, which lowers my Speedmaster 125 estimate by 52.
Hopefully this explains how and why my estimates fluctuate over time. The thing to remember is that with every observation, the impact described above on my estimates decreases. The more serial numbers I observe, the estimates become less volatile or fluid and more accurate.
One comment